
A decade ago, watching a match meant following the ball and maybe glancing at the scoreboard. Now a German fan settling in for a World Cup game has three screens running at once: the broadcast, a second-screen app tracking expected goals, and a group chat arguing about pressing intensity in the 63rd minute. Nobody forced this shift. Fans built it themselves, one downloaded app and one late-night spreadsheet at a time.
The appetite for numbers has spilled well beyond football too. Fitness trackers, sleep scores, step counts – the same generation dissecting xG charts during halftime is often running heart-rate data through apps like slimking to make sense of their own bodies the same way they make sense of a match. The instinct is identical: turn something that used to be felt into something that can be measured, compared, and improved.
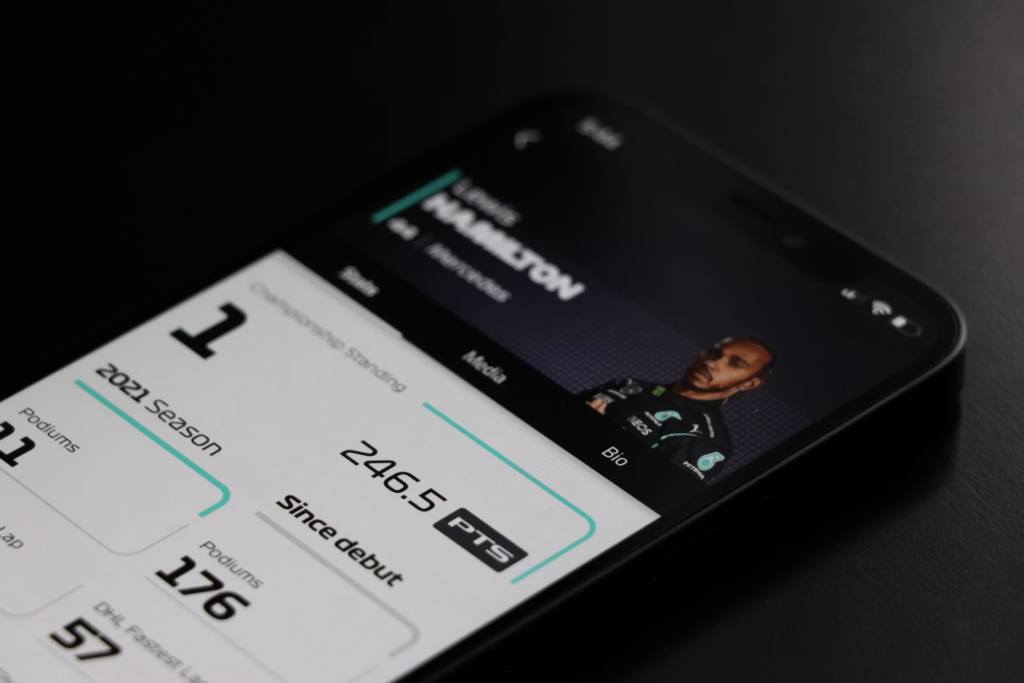
Why the obsession took hold
German football culture has always leaned analytical – Bundesliga clubs were early adopters of tracking technology, and broadcasters here were among the first in Europe to put possession value and pressing metrics on screen during live coverage. What changed with this World Cup is scale. Metrics that used to live in a coach’s tactics room are now sitting in a bar patron’s pocket, updated live, argued over in real time. Part of it is generational. Fans under 35 grew up with fantasy leagues, betting apps, and video games like Football Manager, all of which trained an entire cohort to think in numbers before they think in narrative. Ask a 25-year-old in Cologne why their team lost and they might mention xG differential before they mention the missed penalty everyone else remembers.
The apps driving the shift
A handful of platforms have become fixtures of German matchday routines.
- Live xG trackers – updating expected-goals value possession by possession
- Heat-map overlays – showing where a player actually spent the match, not where commentary assumed
- Passing-network visualizers – turning 90 minutes of movement into a single readable diagram
- Fitness and load apps – repurposed by fans to track their own matchday walks, stress levels, and sleep after late kickoffs
None of these existed in consumer form before smartphones got fast enough to render them live. Now they’re standard kit for anyone serious about the tournament.
How broadcasters responded
Public broadcasters noticed the shift and adjusted coverage accordingly, layering data graphics into halftime analysis that would have looked absurd a generation ago. A pundit now points at a probability cone for a shot rather than simply replaying it. Younger viewers report finding this more satisfying, not less – it turns disagreement into something resolvable rather than purely a matter of opinion.
| Stat Category | What It Measures | Typical Fan Use |
| Expected Goals (xG) | Shot quality, not just shot count | Judging if a win was deserved |
| Pressing Intensity (PPDA) | Passes allowed per defensive action | Arguing tactical discipline |
| Distance Covered | Total km run per player | Spotting fatigue late in matches |
| Pass Completion Under Pressure | Accuracy when closed down | Rating midfield composure |
| Sprint Count | High-speed bursts per half | Comparing wingers’ output |
The psychology behind the numbers
There’s a reason this format has stuck rather than fading as a novelty. Numbers give fans a sense of control over something inherently chaotic. A missed chance stings less when you can immediately check whether it was actually a high-probability shot or a speculative effort that never should have gone in. The data doesn’t remove the emotion – it just gives it somewhere to land.
Sociologists studying fan behavior have noted a similar pattern across other hobbies: running clubs tracking splits to the second, home cooks weighing ingredients instead of eyeballing them, hobbyist cyclists comparing power output down to the watt. Football’s data wave fits neatly into a broader cultural move toward quantifying everyday life, where satisfaction increasingly comes from seeing progress on a chart rather than just feeling it.
Where the trend goes next
Expect the gap between broadcast and second screen to close further. Some German streaming services already test synced overlays that update as the match happens, removing the need to switch apps entirely. Whether that improves the experience or just adds noise is still being debated among fans themselves – plenty argue the numbers are best digested after the final whistle, over a beer, not during the run of play.
What’s unlikely to change is the underlying habit. Once fans learn to see a match as a dataset as well as a spectacle, there’s no real going back to watching blind. The scoreboard was never going to be enough again.
